Core Features
The core of Bianor is the Map Explorer, designed to visualize trained Self-Organizing Map (SOM) topologies, projections, and predictions with responsive layer controls.
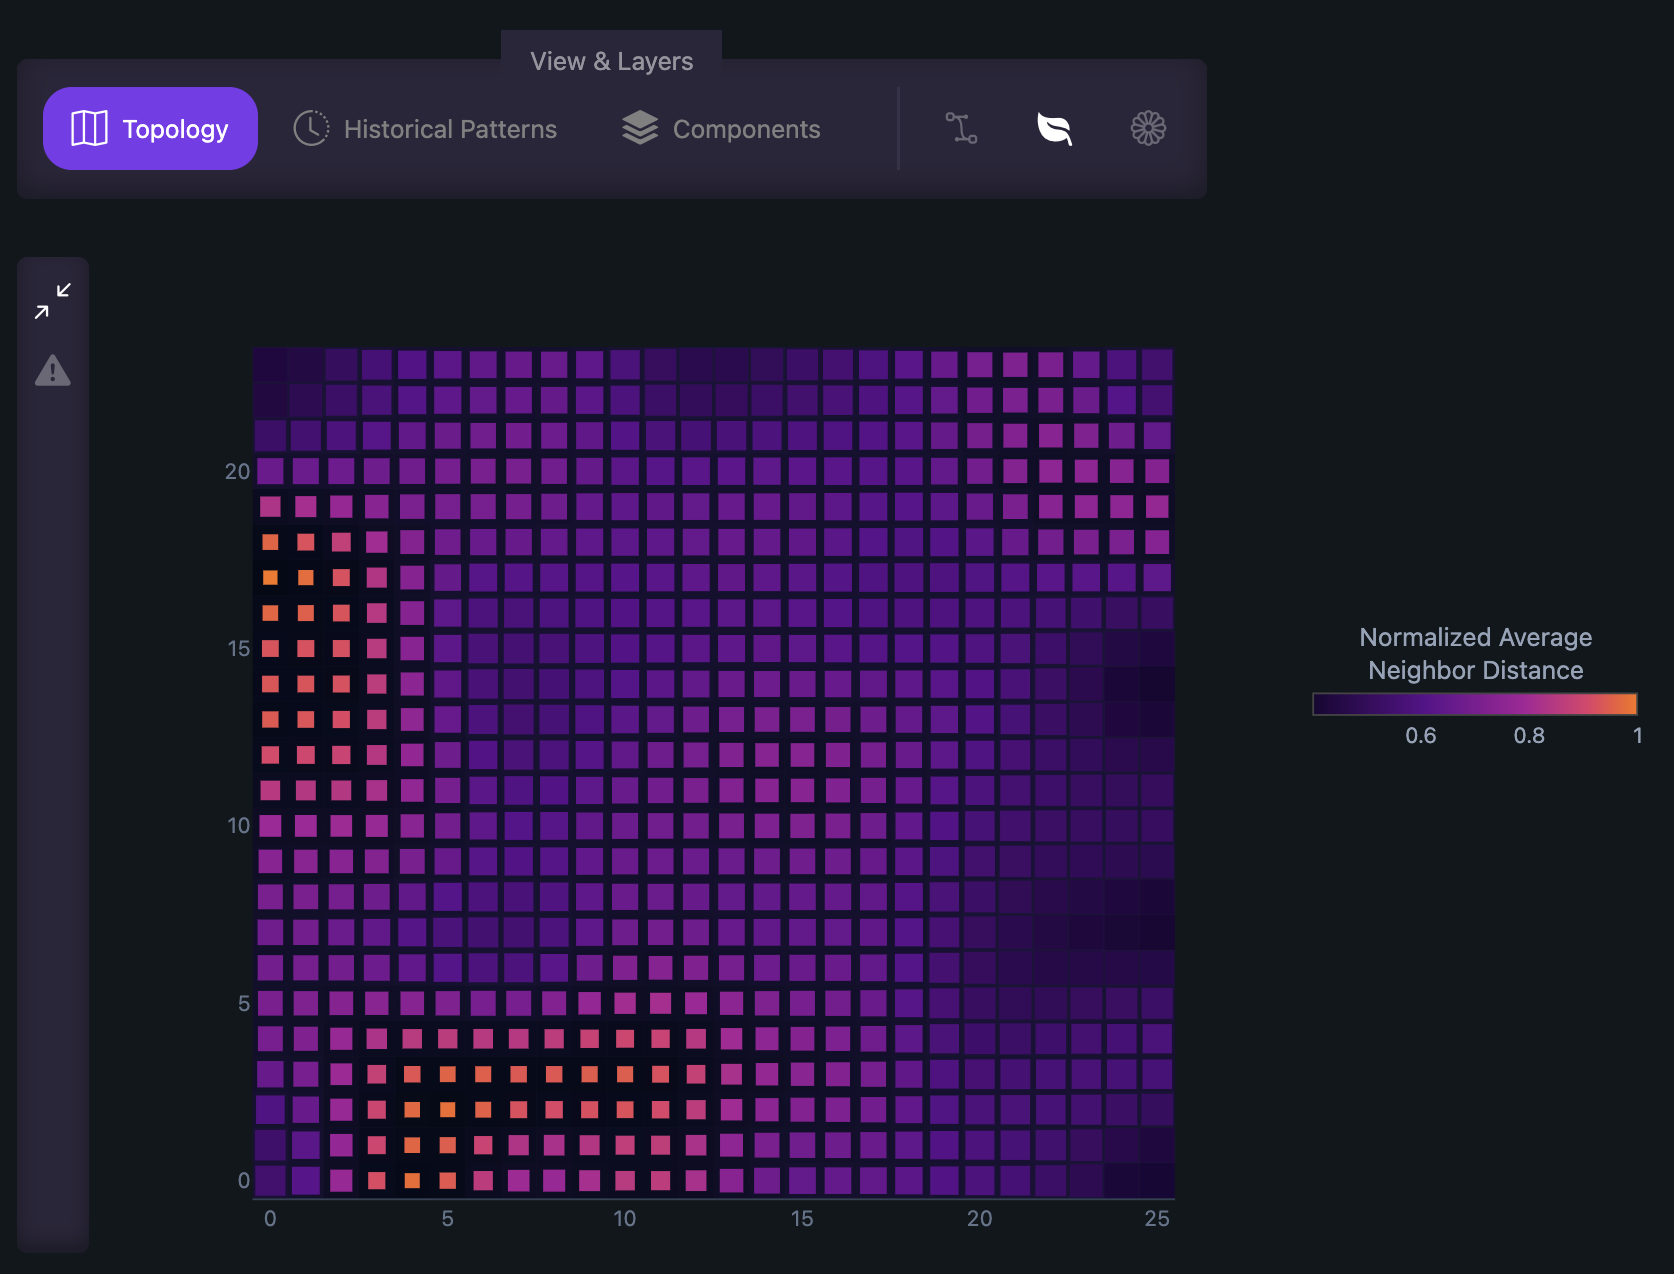
Displays the topology of the trained Self-Organizing Map in 2D space. Analytical layers can be combined and toggled:
Visualizes distance between adjacent nodes to distinguish dense clusters from sparse boundaries.
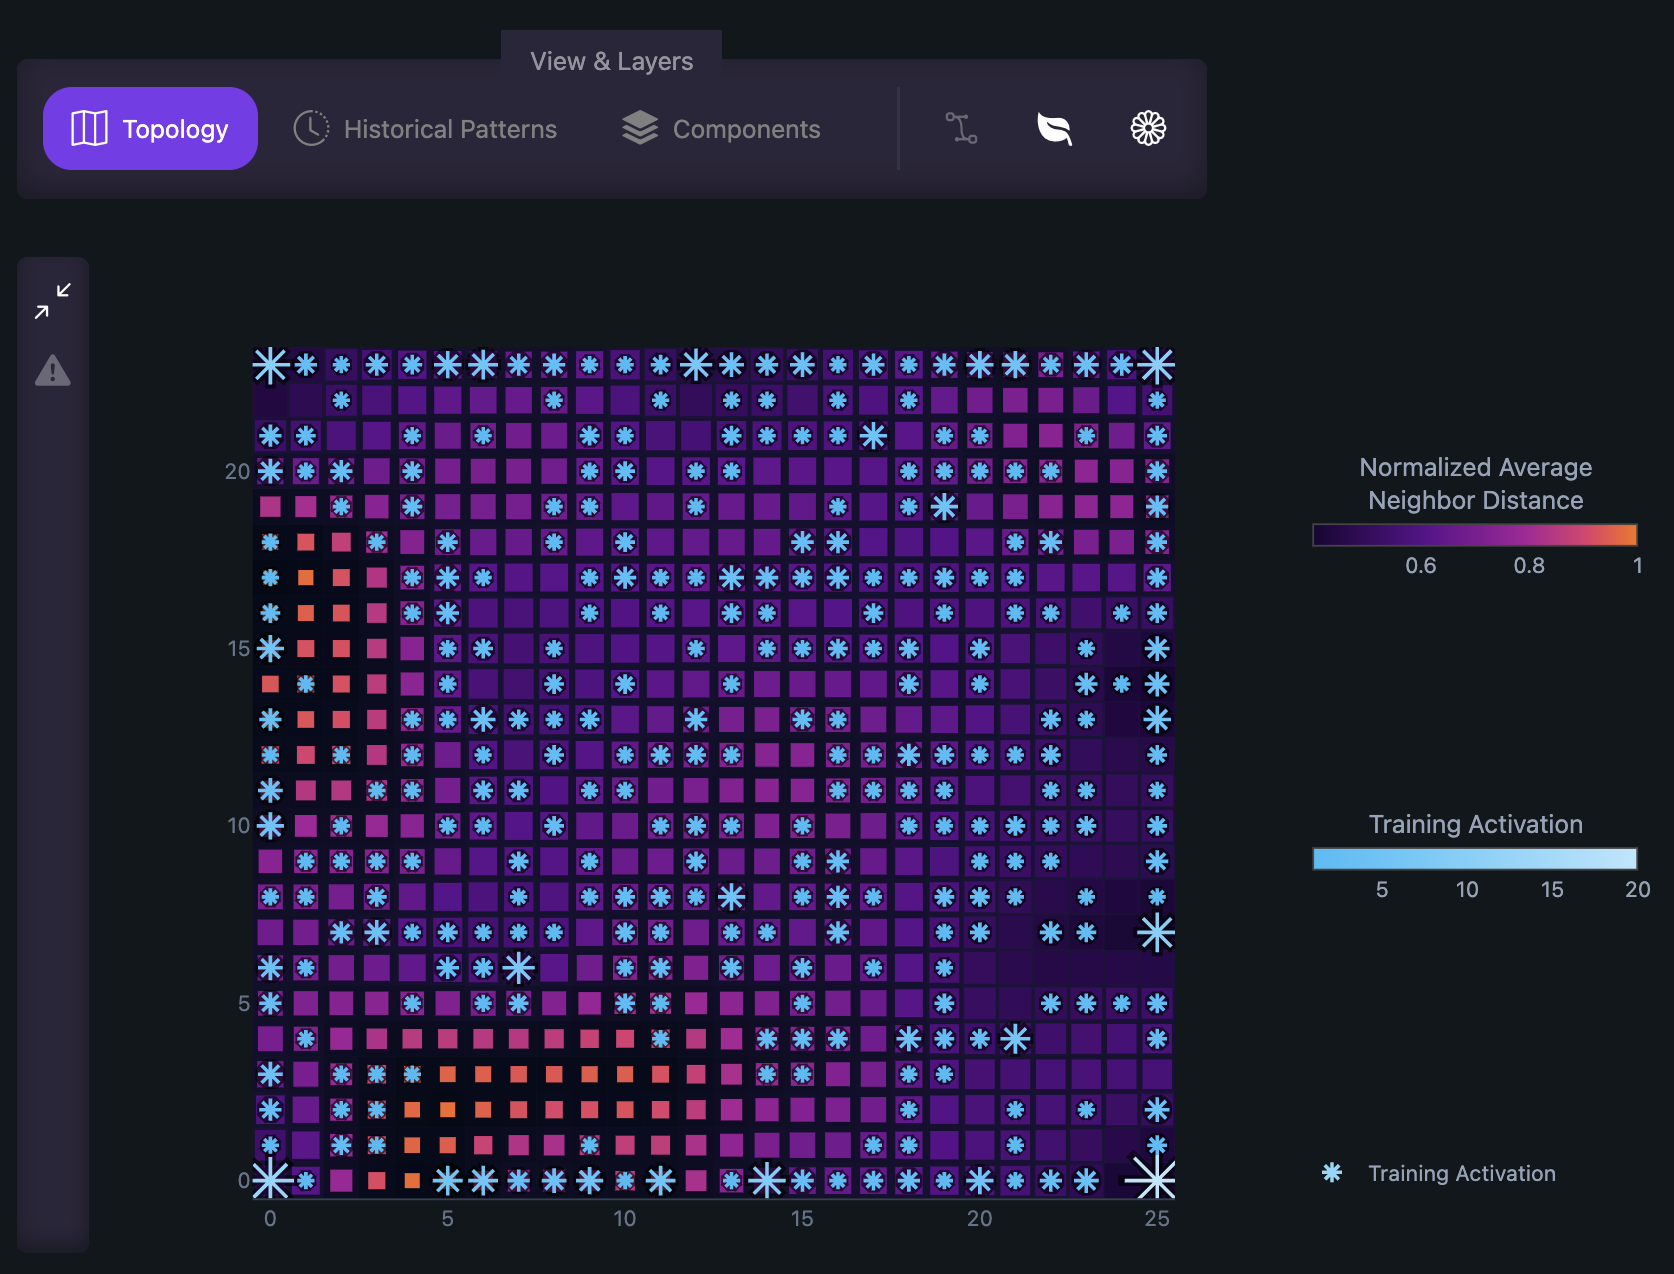
Overlays node activation frequencies to inspect training sample density across clusters.
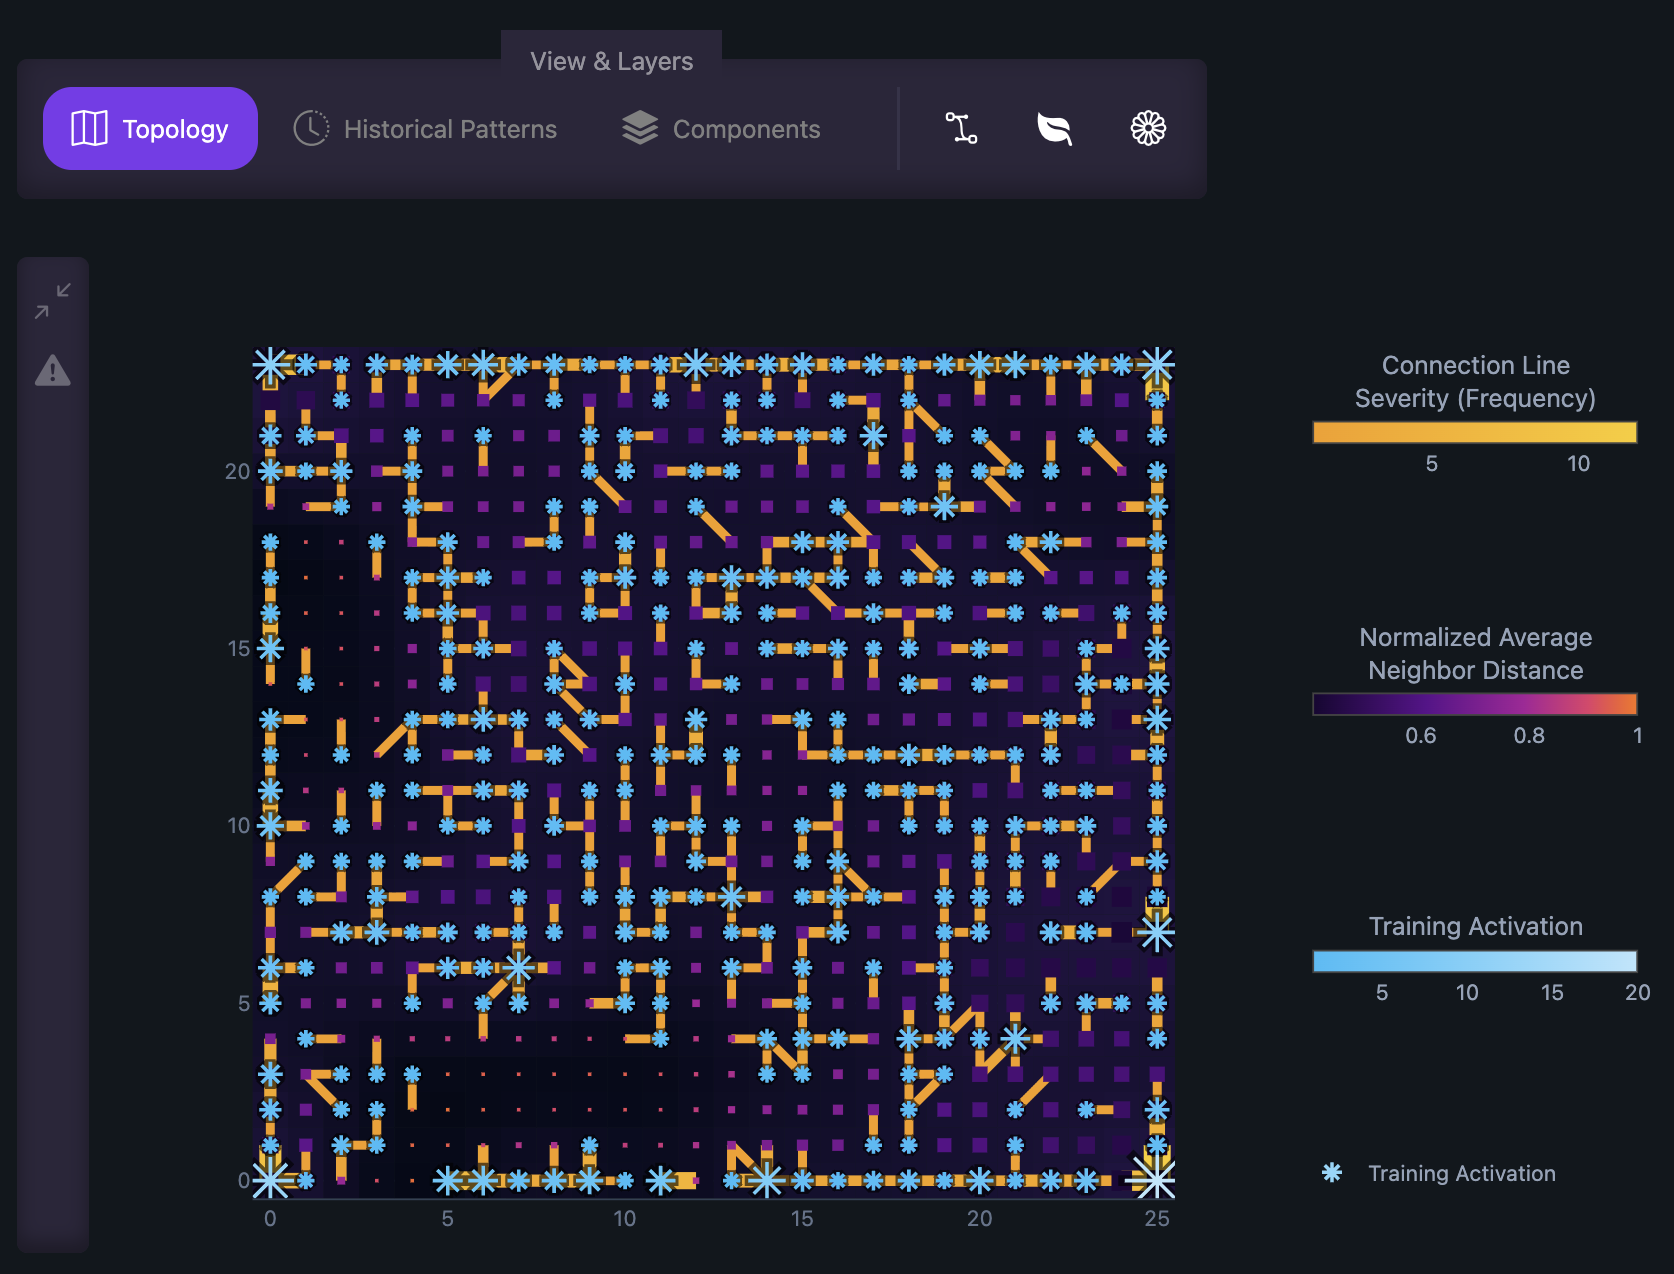
Renders connection lines between first and second best-matching nodes of training data, revealing grid continuity, map quality, data complexity, and dispersion.
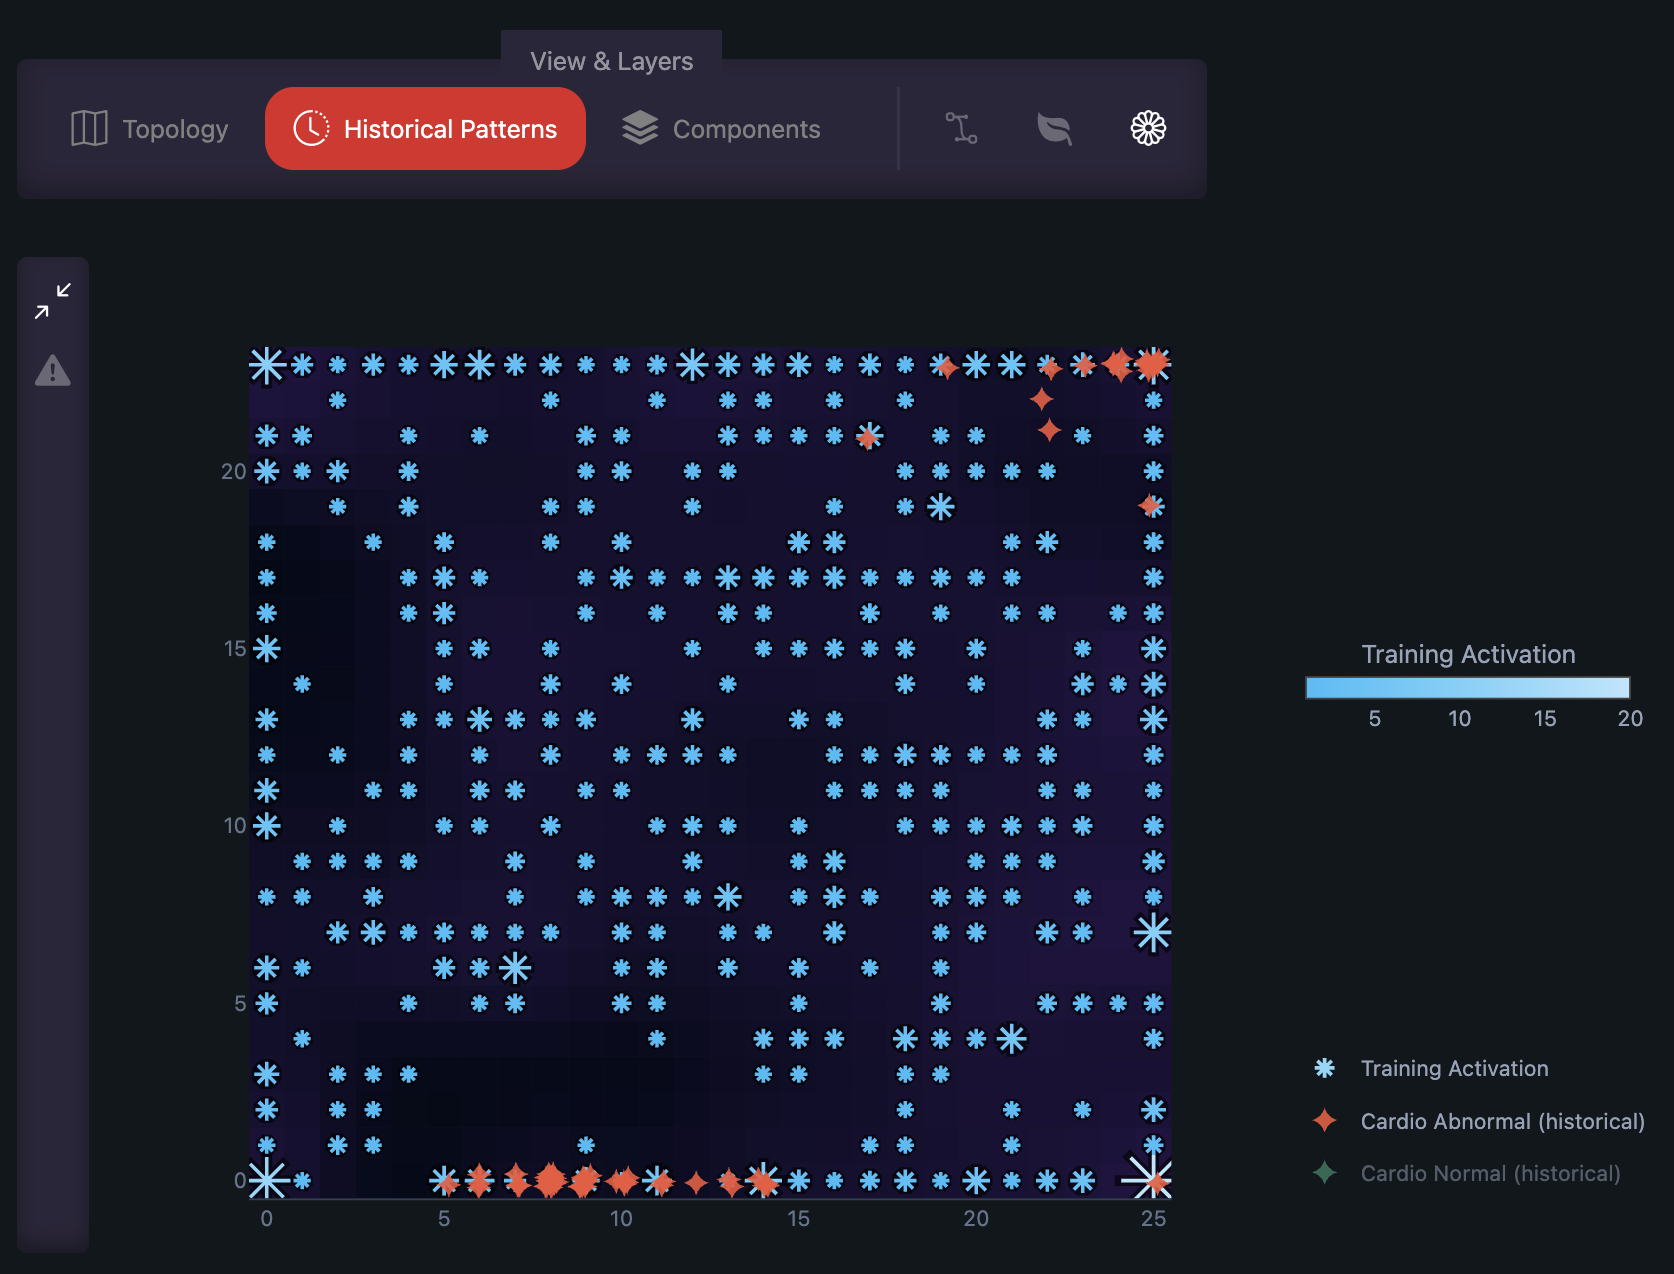
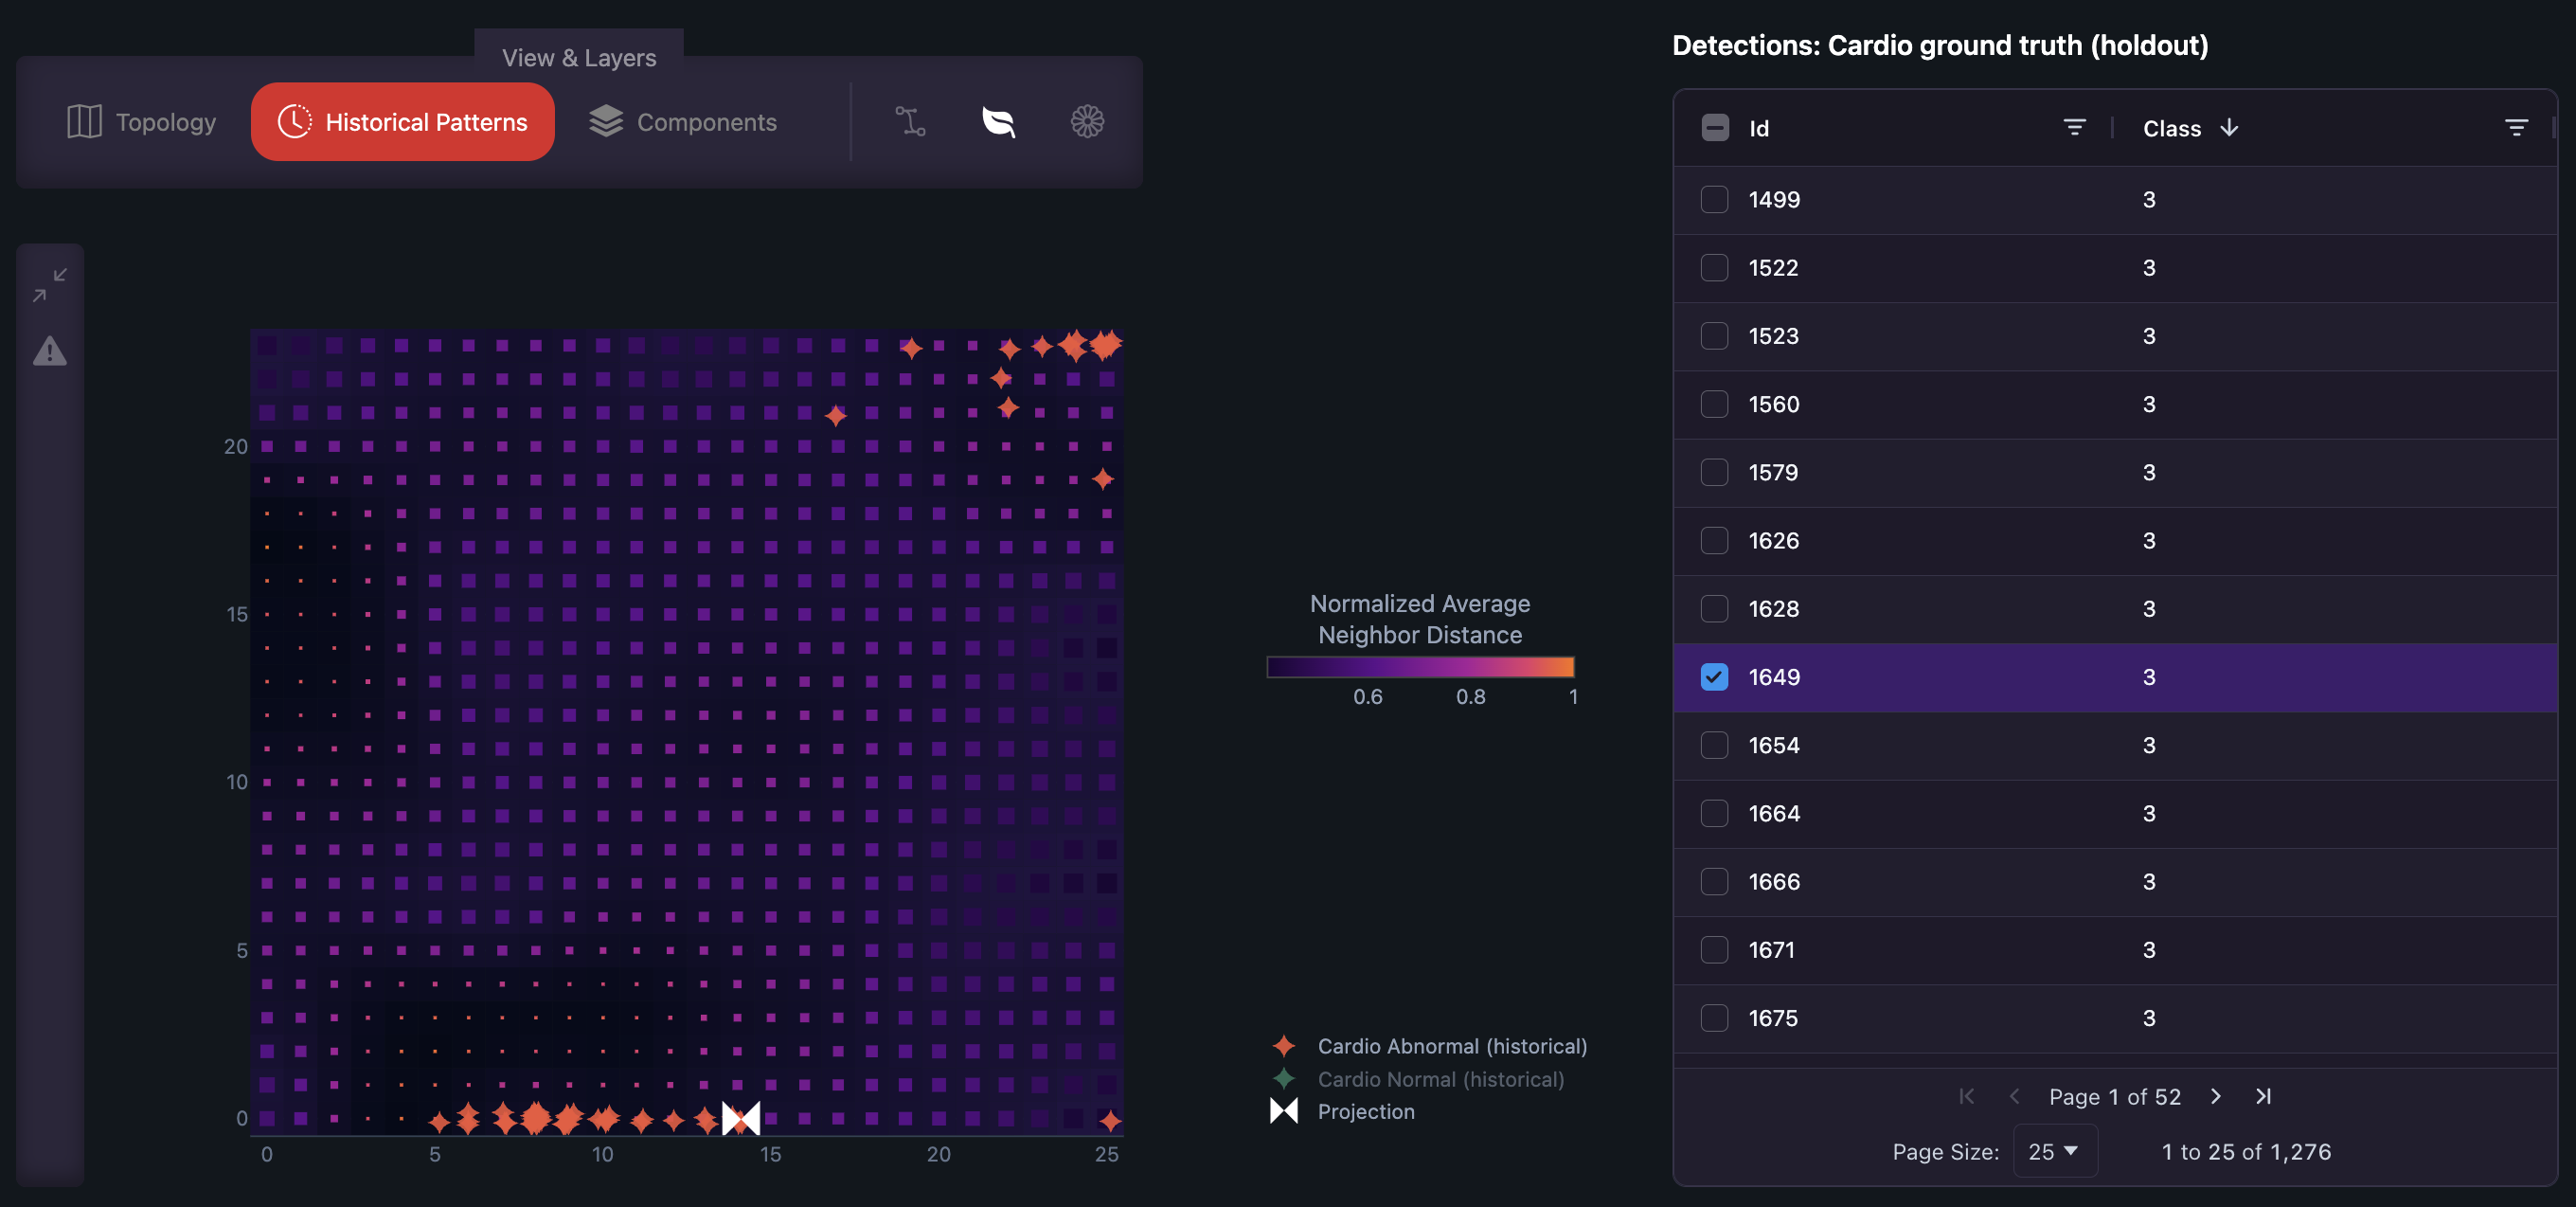
Visualizes historical sample projections mapped directly onto the trained topology.
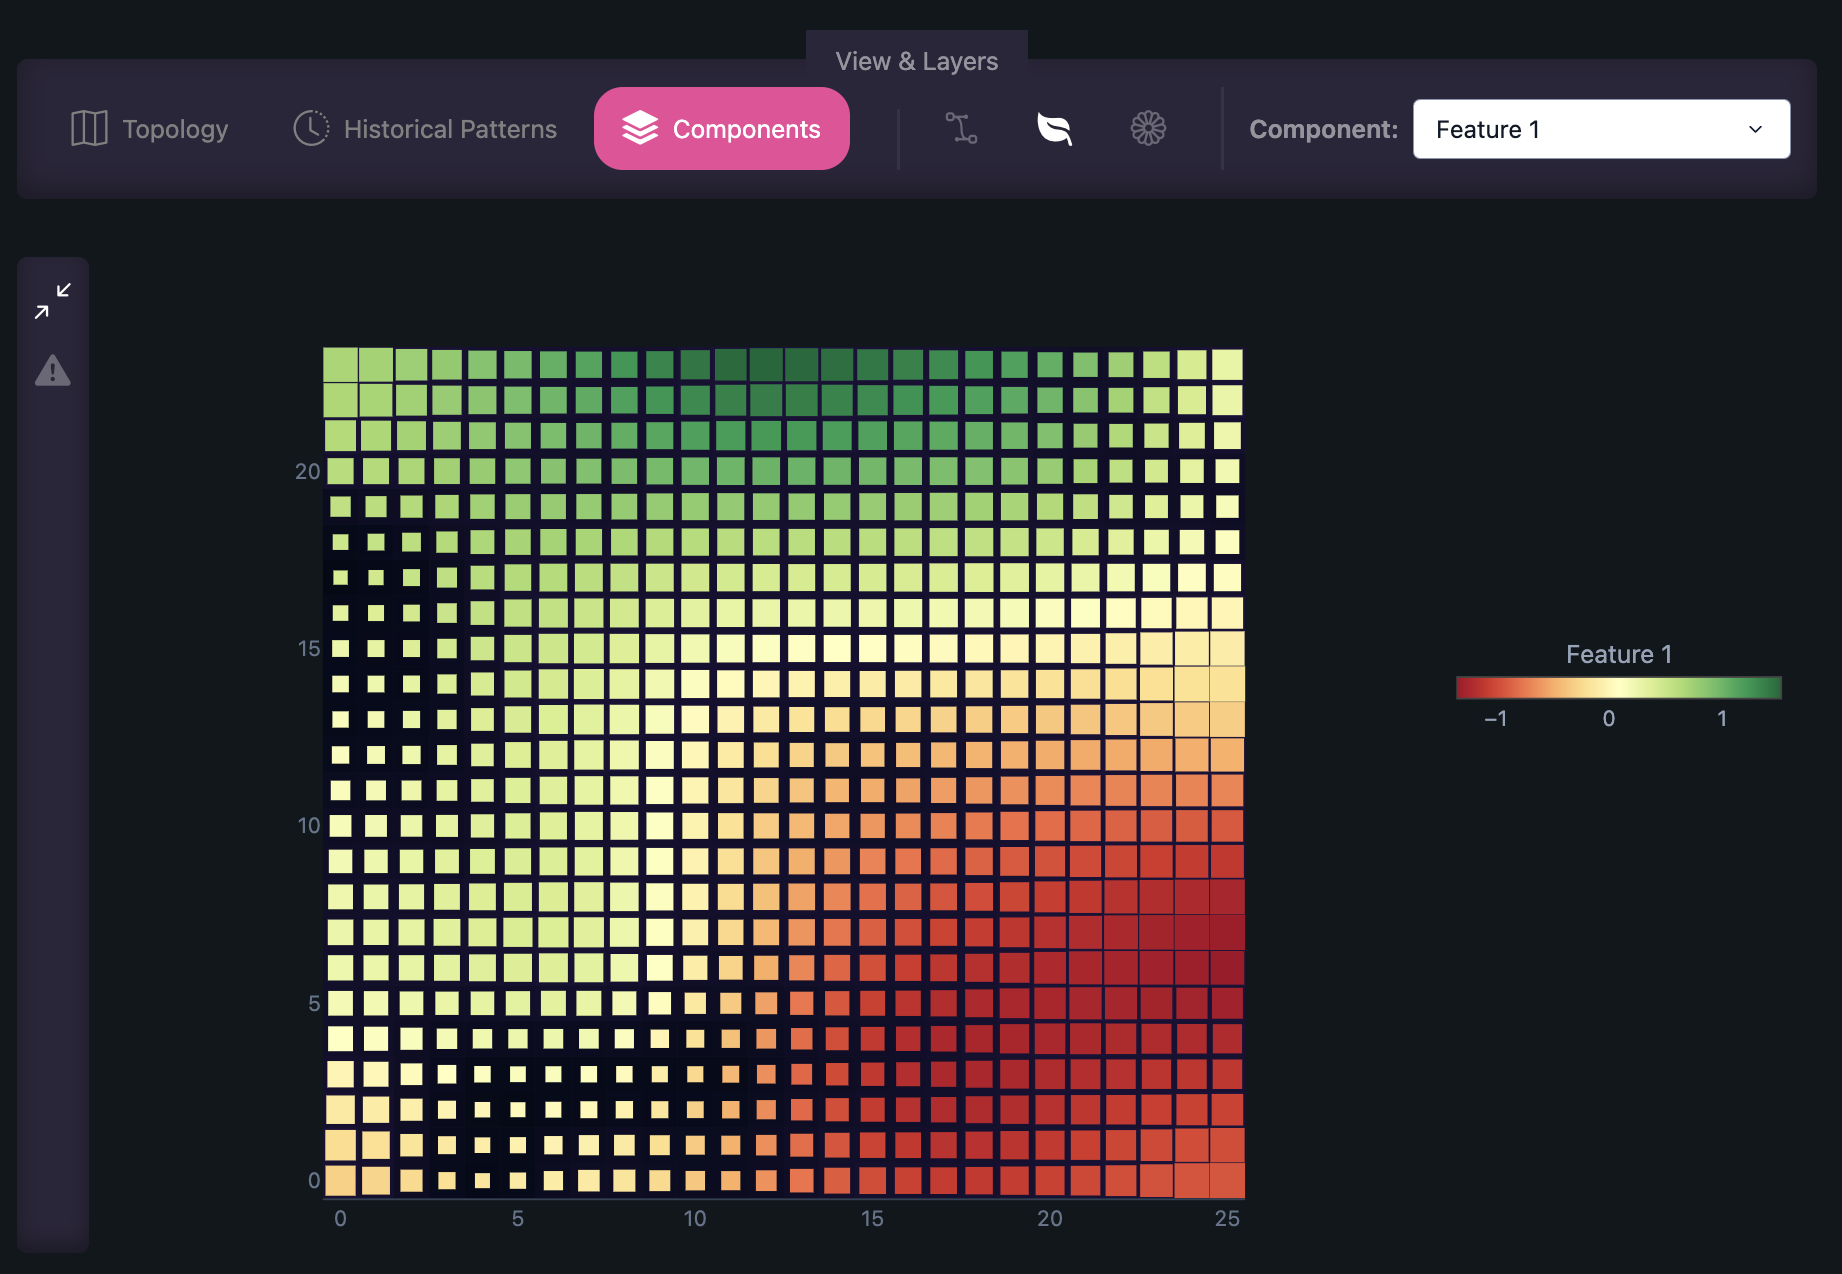
Visualizes the component value of the map nodes based on a single selected feature.
Projects external predictions onto the topology to identify surrounding patterns.
Next Steps
- Check the Prerequisites to set up Bianor in your workspace.
- Follow the Launch Guide to deploy your application.
- Learn how to train and link models in Modeling & Configuration.